
Reporting Guide
Setting up your report
Reporting in Veracity allows you to slice your data in multiple ways. There are three report types available:
- Single campaign
- Campaign comparison
- Date comparison
Single campaign
This report type enables you to generate a report on a single campaign over a set period of time.
Campaign comparison
This report type enables you to generate a report based on multiple campaigns over the same period of time in order to compare their performance against a number of metrics, such as visits and conversions.
Date comparison
This report type enables you to generate a report based on one campaign over two date periods in order to compare their performance against a number of metrics, such as visits and conversions.
Creating a report
When you first start creating a report, you will be presented with the on-screen helper that will guide you through the creation of your first report.
You will see a different guide depending on the type of report you are generating. Reports contain the following fields, each of which we will run through now:
- Date period selector
- Campaign selector
- Report sections: Overview; Spend; Leads; Channels
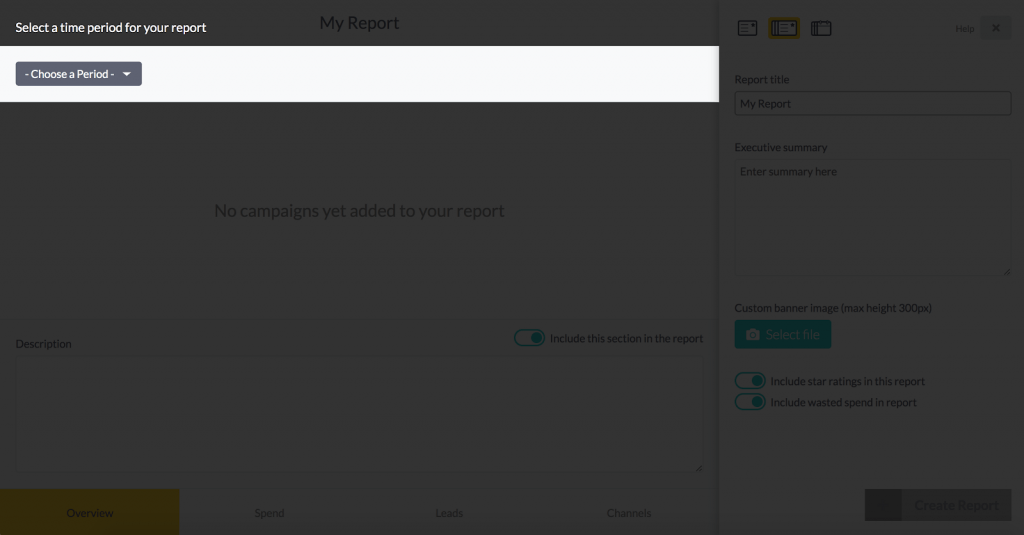
- Report title
- Executive summary
- Custom banner image
- Report options: Star rating inclusion; Wasted spend inclusion
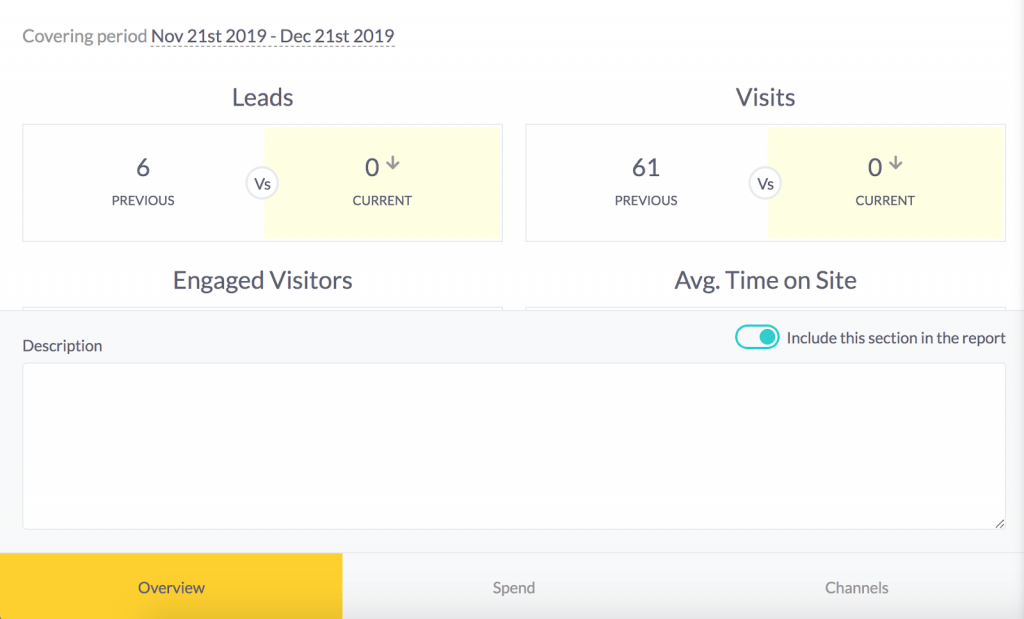
Date period selector
Reports can be generated against a set date range. The date period can be changed at any time during report creation, and the report will be updated accordingly.
Campaign selector
If you are creating a single campaign report or a date comparison report, you will only be able to select one campaign. If you are creating a campaign comparison report, you will be able to add as many campaigns to your report as you wish.
To remove campaigns from your report, use the red cross next to each campaign in the bottom-right of the report builder screen.
Report sections
Each report is split into sections: overview, spend, leads and channels (note: the date comparison report does not contain the leads section as leads are included in the overview section).
Each section contains a text box for you to construct your own summary, based on the data you see in the preview area above.
Report title
This field enables you to create a custom title for your report
Executive summary
The executive summary provides an introduction to the report. If you are generating a PDF report, this summary will appear on the first page of the report.
Custom banner image
On the executive summary page there is a default image. Use this field to override the banner with your own custom image. It must be a 2:1 ratio, for best results, use a landscape image with a minimum size of 400 x 200 pixels. For more information on report images see here.
Report options
The report options contains two toggles: star rating and wasted spend. Sometimes, you may not wish to include star ratings or the wasted ad spend in your report. Use these toggles to add or remove them from your report.
Creating your report
After your report has been configured, you can create it by hitting the “create report” button at the bottom-right of the report builder. On the next screen you will be asked to enter a password. This ensures that your report data can only be accessed by those with permission (i.e. your clients or internal stakeholders).
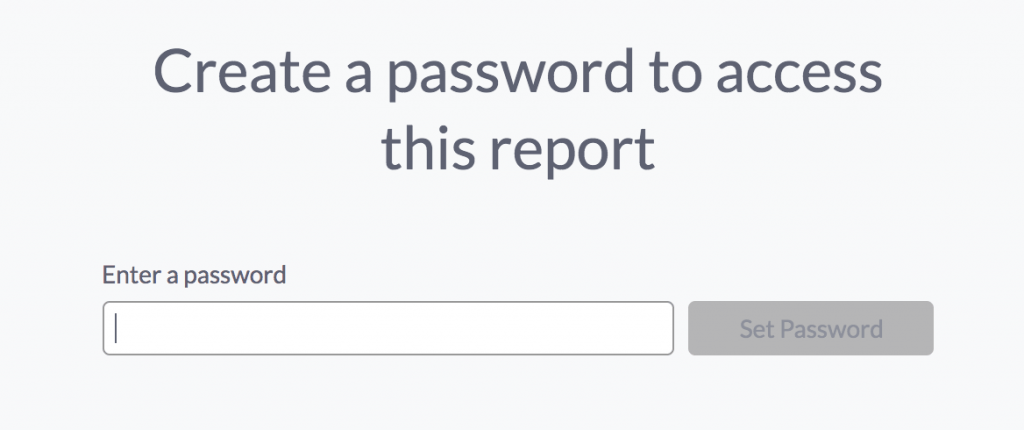
Enter a password and click “set password”
Accessing your reports
After you have created a report, you will be taken to a list of your reports. It will take up to 30 minutes for your report to become available, whilst the Veracity system generates it in the back-end. Once available, you will be given a unique URL in which to access the report. Visit this URL in a browser and you will be given two report type options:
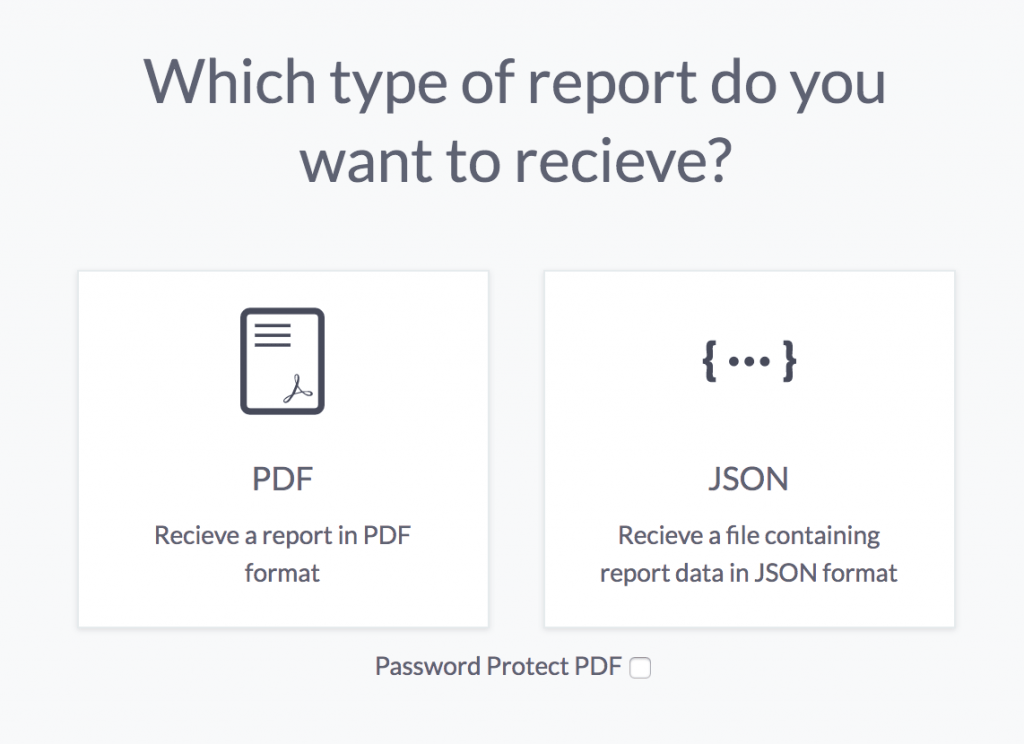
Selecting PDF will download a PDF version of your report. The JSON report type provides a raw data version of the data which can be used to import into other systems.